
The 7 Reports Every Garage Floor Coating Business Should Actually Look At
Ask any business guru — or any AI — what reports you should be looking at, and you will get the same generic list: income statement, balance sheet, cash flow. Those matter at tax time. But none of them tell you whether Tuesday's two-car garage made money, whether your Facebook ads are outperforming your yard signs, or whether your crew has enough booked work to hit the year.
A garage floor coating business is a specific machine: physical labor, chemical inventory, one-day installs, and direct-to-consumer sales with a quote-chase-close loop. The reports that run it are specific too. Here are the seven we actually look at — with real screenshots from CoatingOS, running on a working 7-figure coating company's data.
1. Job Profitability — Which Floors Made Money
The single most important report in the building. Every work order gets revenue, expenses, profit, and margin — so "we had a busy month" turns into "we made 96% margin on labor-only jobs and 80% when we sub out concrete repair."
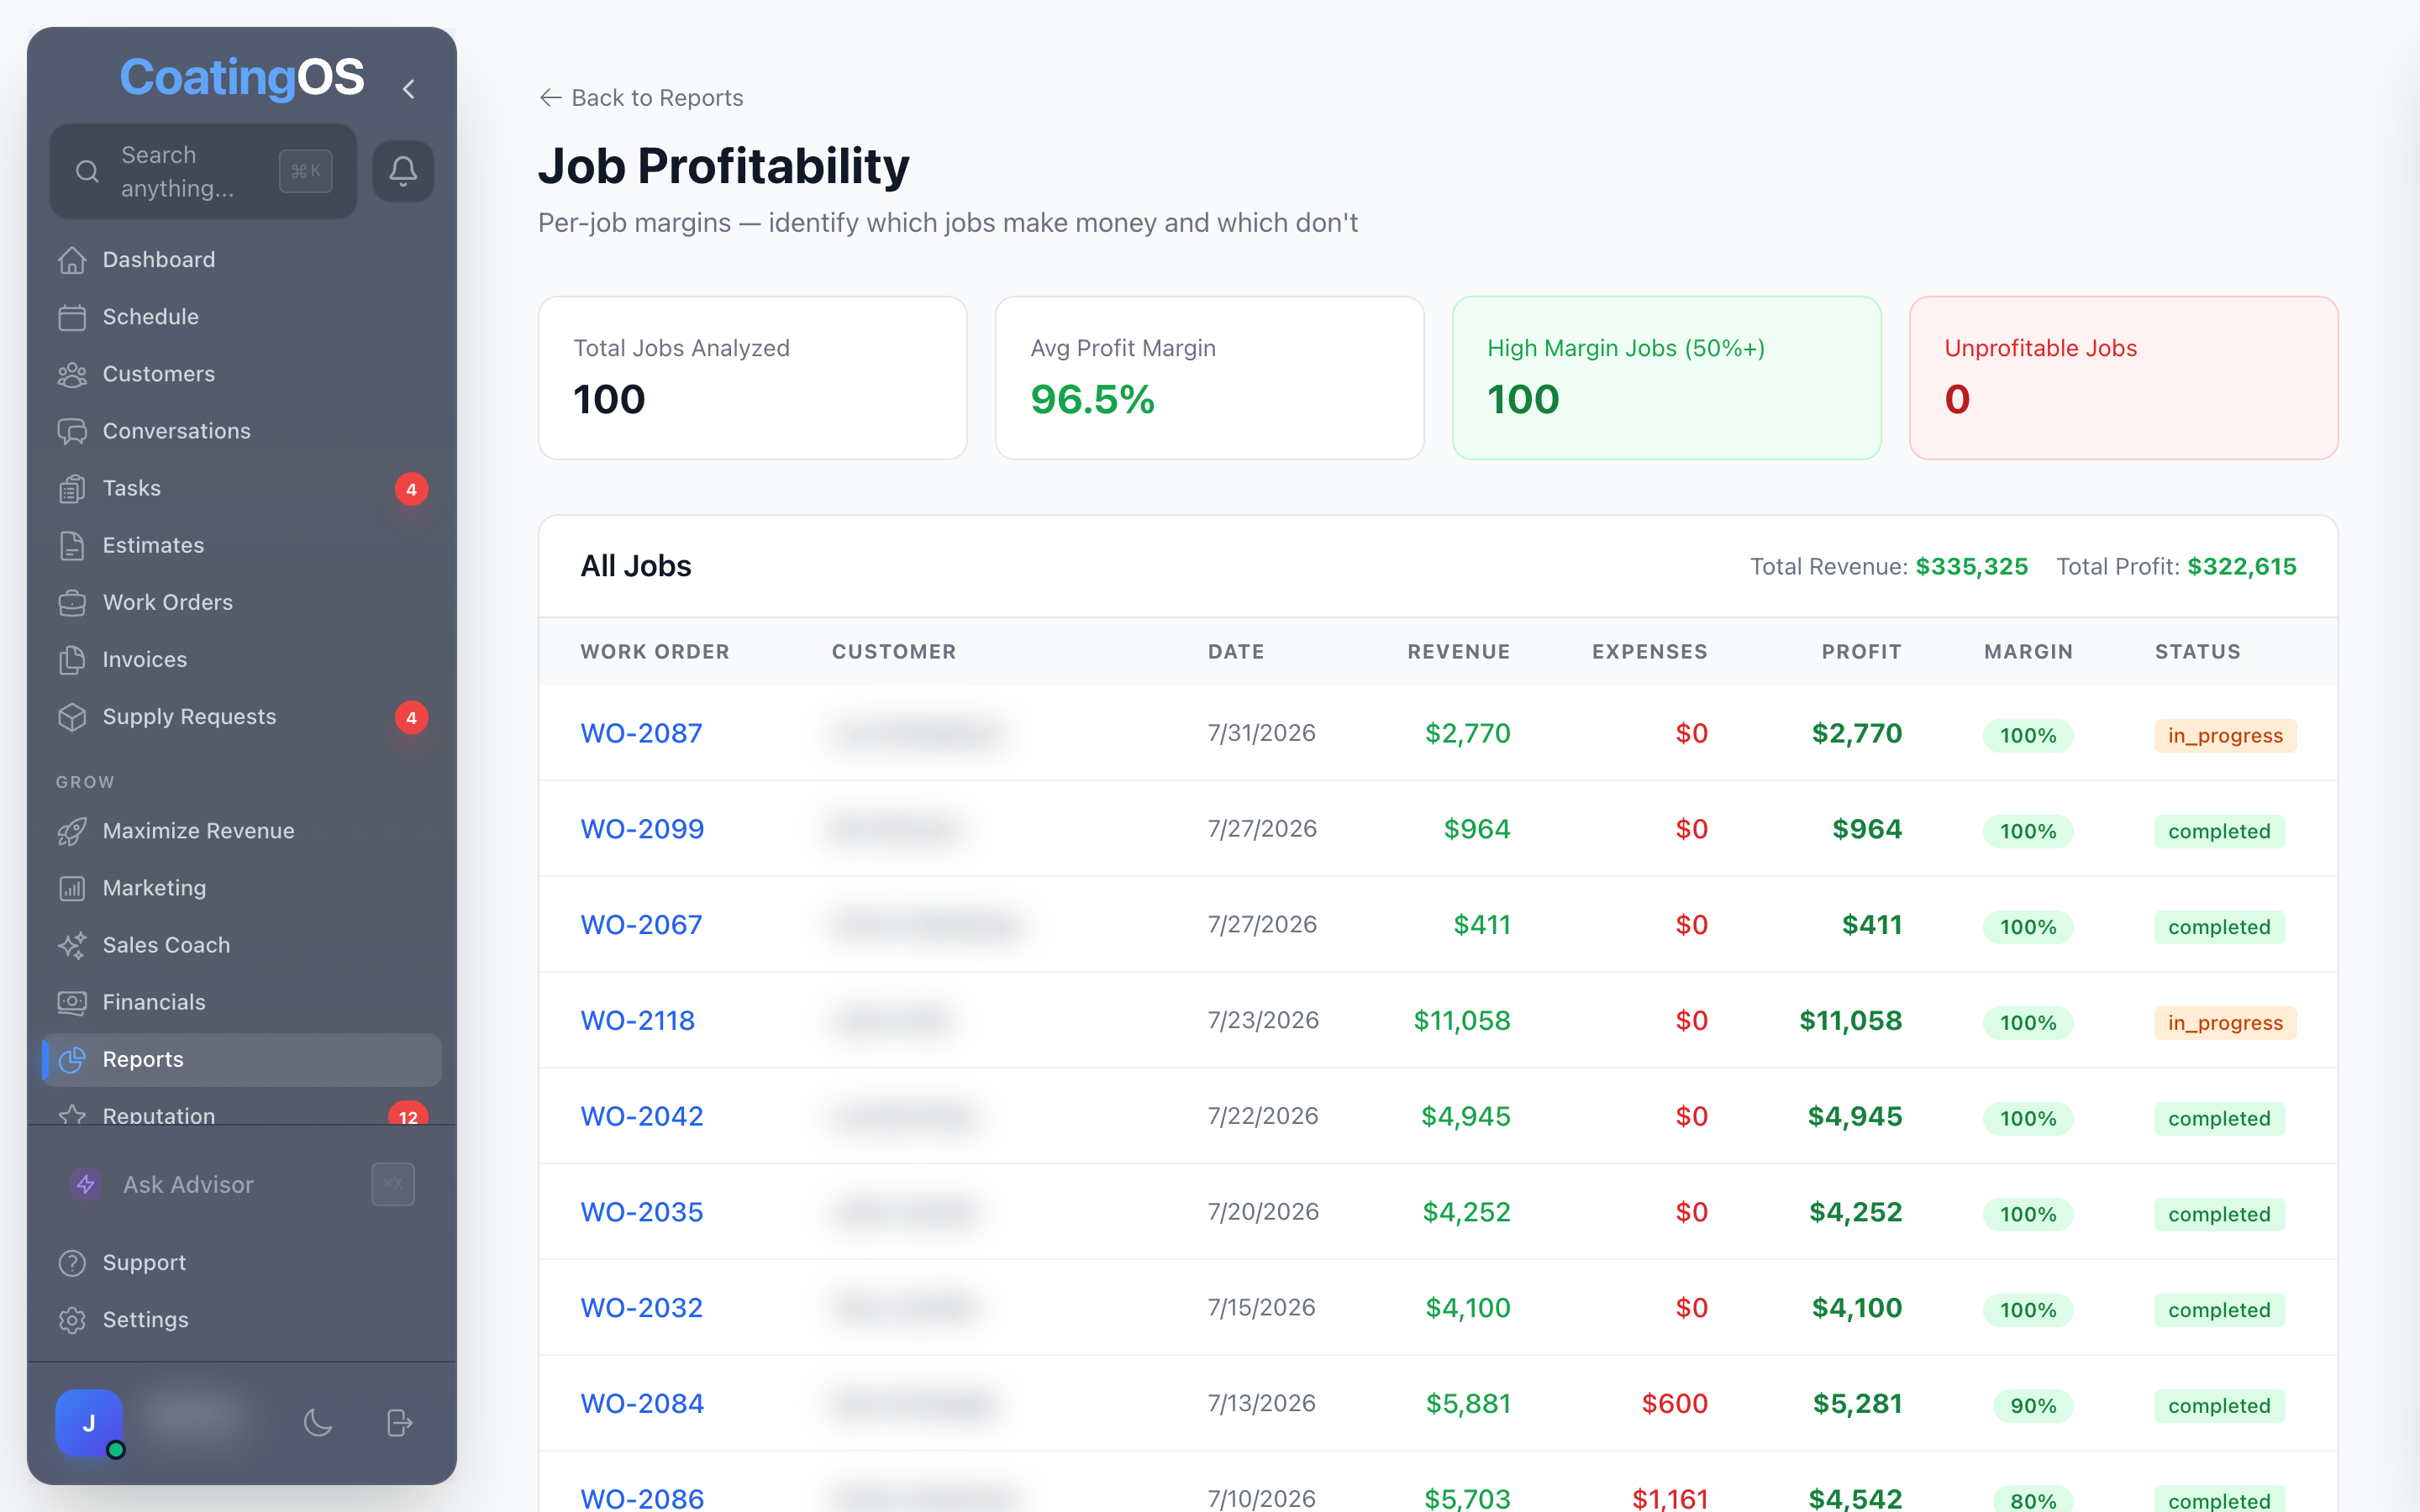
What to look for:
- Unprofitable jobs — every one has a story: underquoted prep, a moisture surprise, a redo. Find the pattern.
- Margin by job type — polyaspartic full-flake vs. grind-and-seal vs. patios. One of them is quietly your best business.
- Expense drift — material costs creep. Your margin column notices before your gut does.
If you only build one reporting habit, make it this: look at every completed job's margin once a week.
2. Lead Source Performance — Where the Good Customers Come From
Not all leads cost the same, and not all of them close the same. This report answers the only marketing question that matters: which channel turns ad dollars into installed floors?
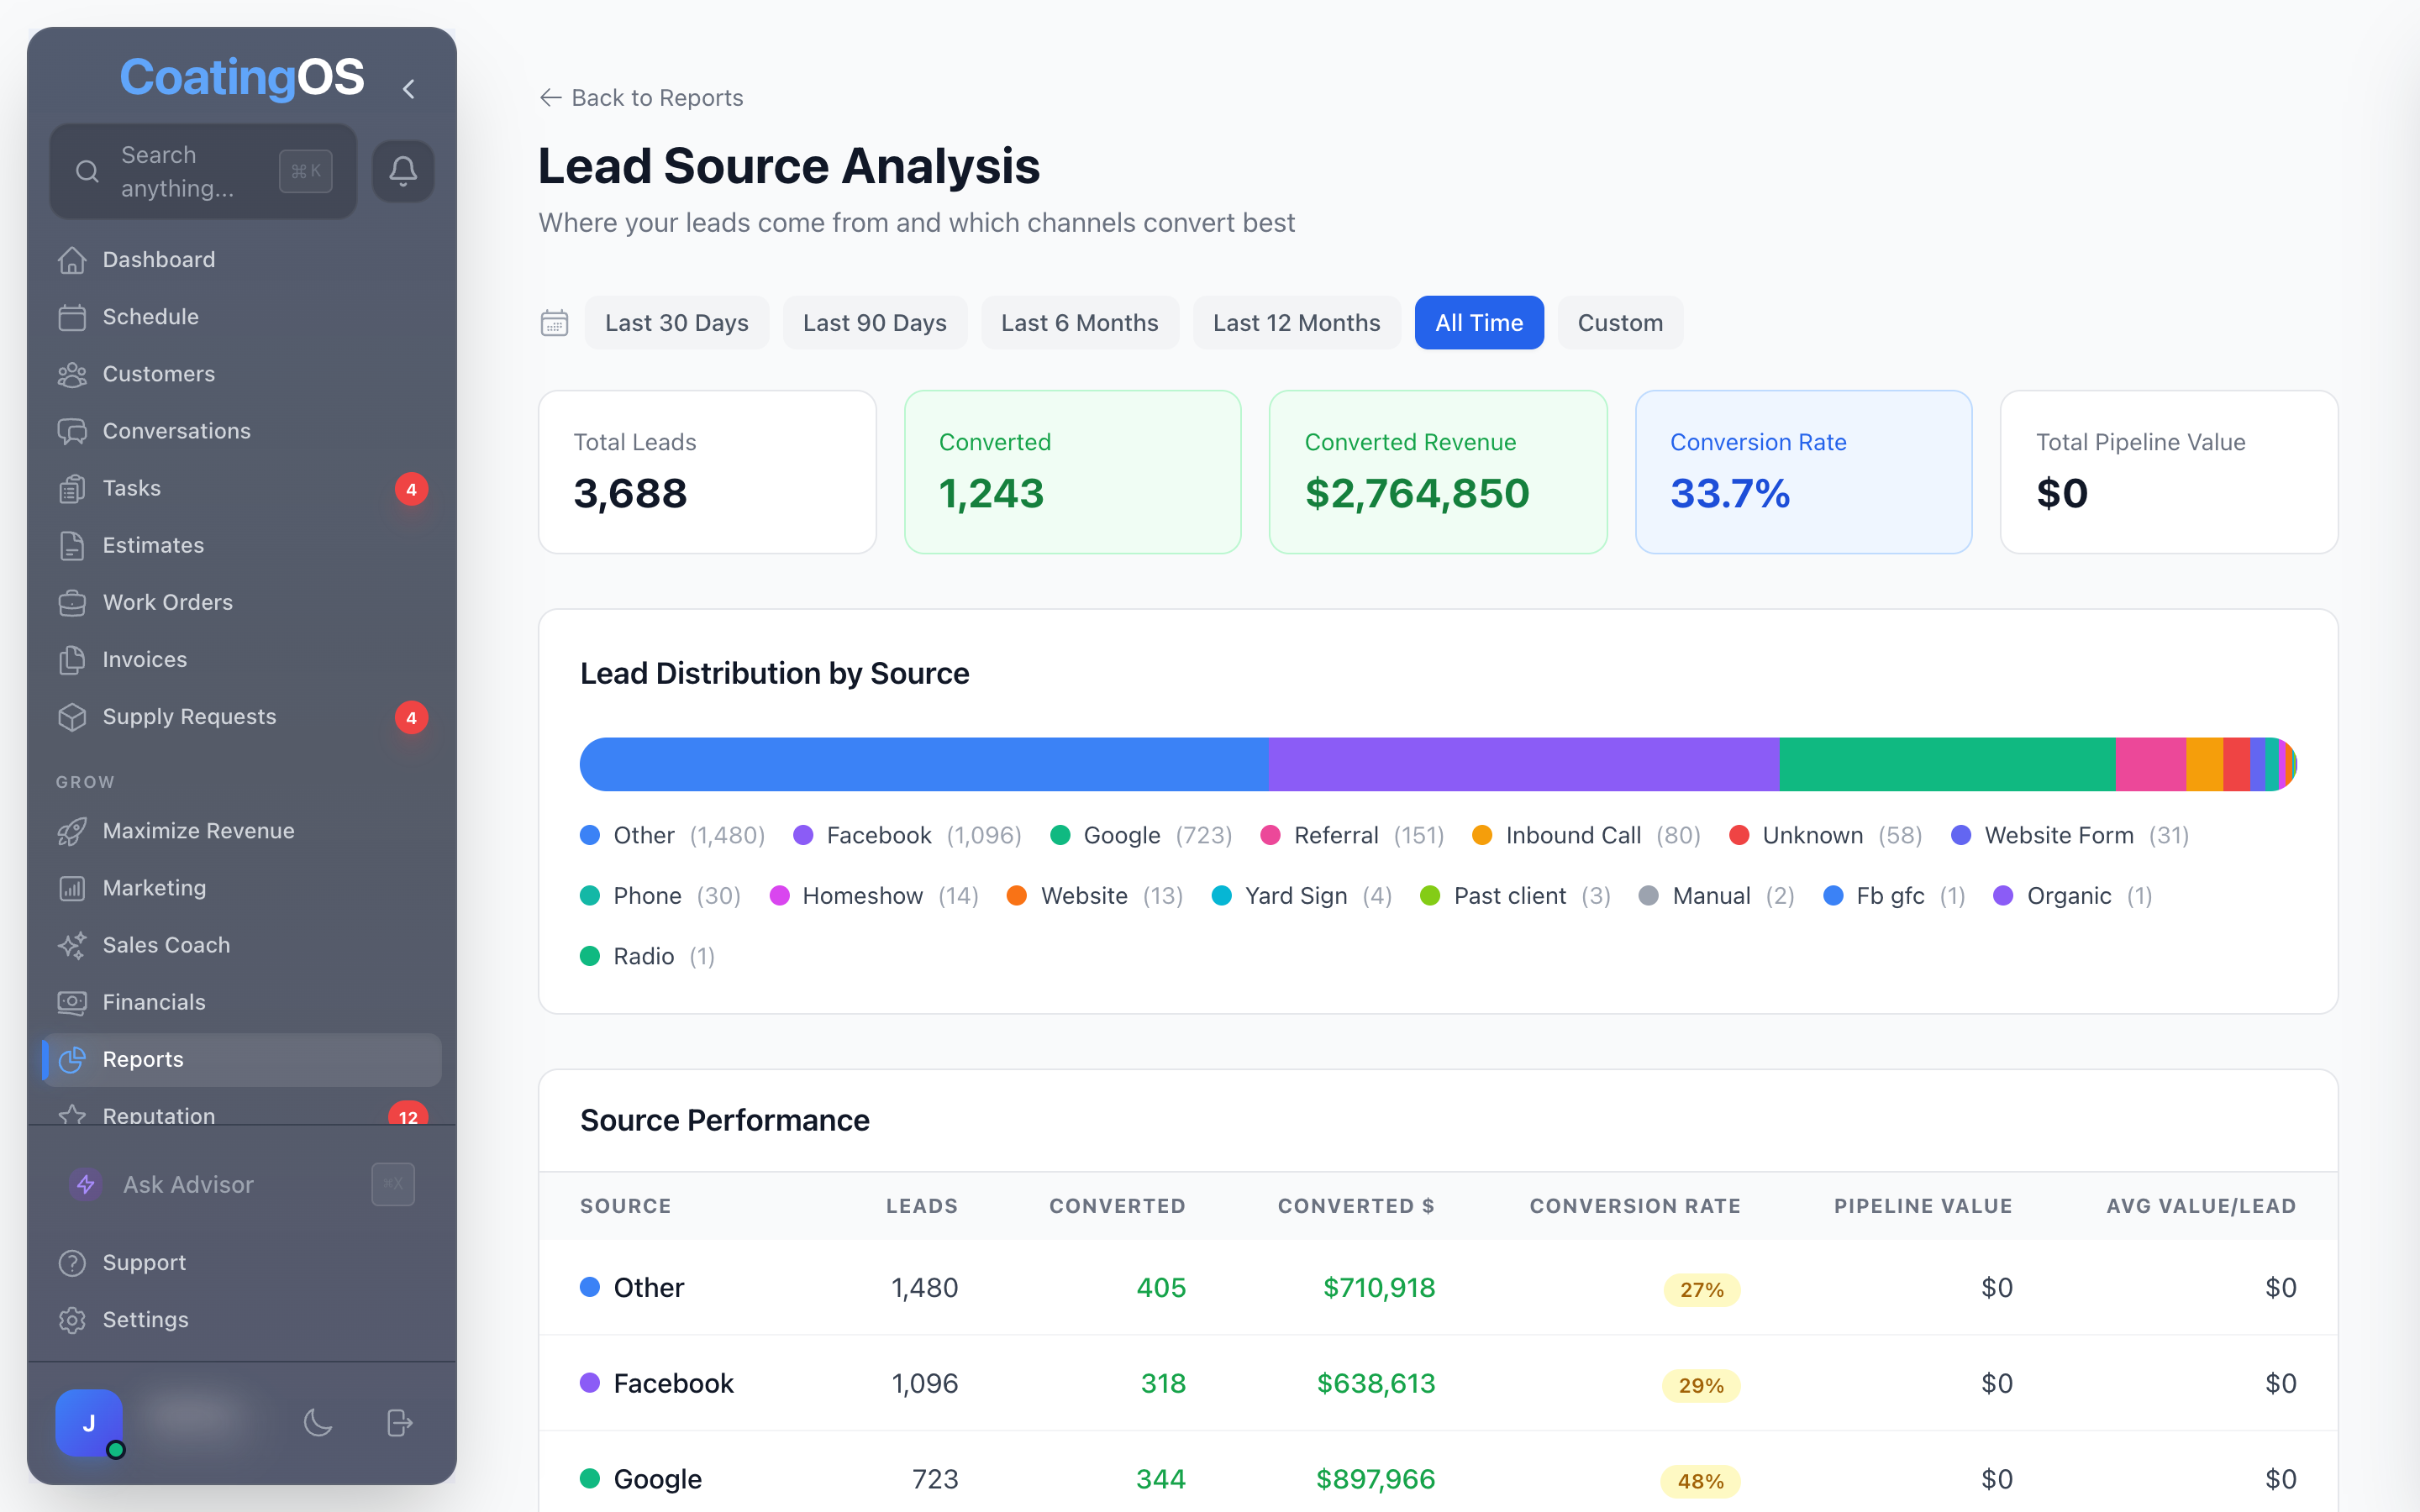
In the example above, Google leads convert at 48% while Facebook converts at 29% — but Facebook produces nearly half again as many leads. That is not "Google good, Facebook bad." That is a budget allocation decision you can actually make: Facebook fills the funnel, Google closes hot intent, and the yard signs are basically free.
Track per source: lead count, conversion rate, converted revenue, and cost per lead. Kill or fix any channel that cannot explain itself after 90 days.
3. Estimate Conversion — The Money You Already Touched
Every estimate you send is a customer who raised their hand. The conversion report tells you how many of them turned into booked jobs, how long it took, and — the part that stings — how much quoted money is still sitting in "pending."
Most coating companies lose more revenue to silence than to competitors. The fix is boring and automatic: follow-up sequences that fire until the customer answers. Watch two numbers: your close rate on quoted work, and your days-to-close. When follow-up is automated, days-to-close drops first, then close rate follows.
4. Speed to Lead and Answer Rate — The Report Nobody Runs
Homeowners get three quotes. The contractor who calls back in five minutes wins a disproportionate share of them. Almost nobody measures this, which is exactly why it is an edge: median minutes-to-first-response, percentage of calls answered, and how many missed calls never got a callback at all.
This is a report that should be live, not monthly — a missed call from a new lead is a fire, not a data point.
5. Average Job Value — Are You Selling or Just Quoting
Your average ticket tells you whether crews and salespeople are upselling: stem walls, aprons, patios, containment mats, a second bay. A $200 bump on a $3,500 average across 140 jobs a year is $28,000 of nearly free revenue. Watch the trend monthly; if it is flat while material prices rise, your pricing is quietly eroding.
6. Crew Capacity and Schedule Fill — Can You Even Take the Work
Marketing reports tell you about demand. This one tells you about supply: how many weekdays are booked, how far out, and how much revenue room is left at each crew's daily goal. It is the difference between "we should run more ads" and "we should not — we are booked five weeks out and need a second crew first."
7. Revenue Pacing — The Year, Every Morning
The report that ties it all together: where you stand against the annual goal, what the daily target needs to be from here, and what that means in leads, estimates, and jobs. Not a spreadsheet you build in January and abandon — a live number that greets you every morning.
This is the top of the CoatingOS dashboard: goal, pace, gap, and the "what it takes" math (ad spend → leads → estimates → jobs) recalculated daily from your own close rates.
One Screen Instead of Seven Spreadsheets
None of these reports are exotic. Any determined owner could build them in spreadsheets — and abandon them by March, because manual reporting always loses to a busy season. The reason we built the reporting layer directly into CoatingOS is that the reports assemble themselves from the work you are already doing: estimates, invoices, calls, and schedules.
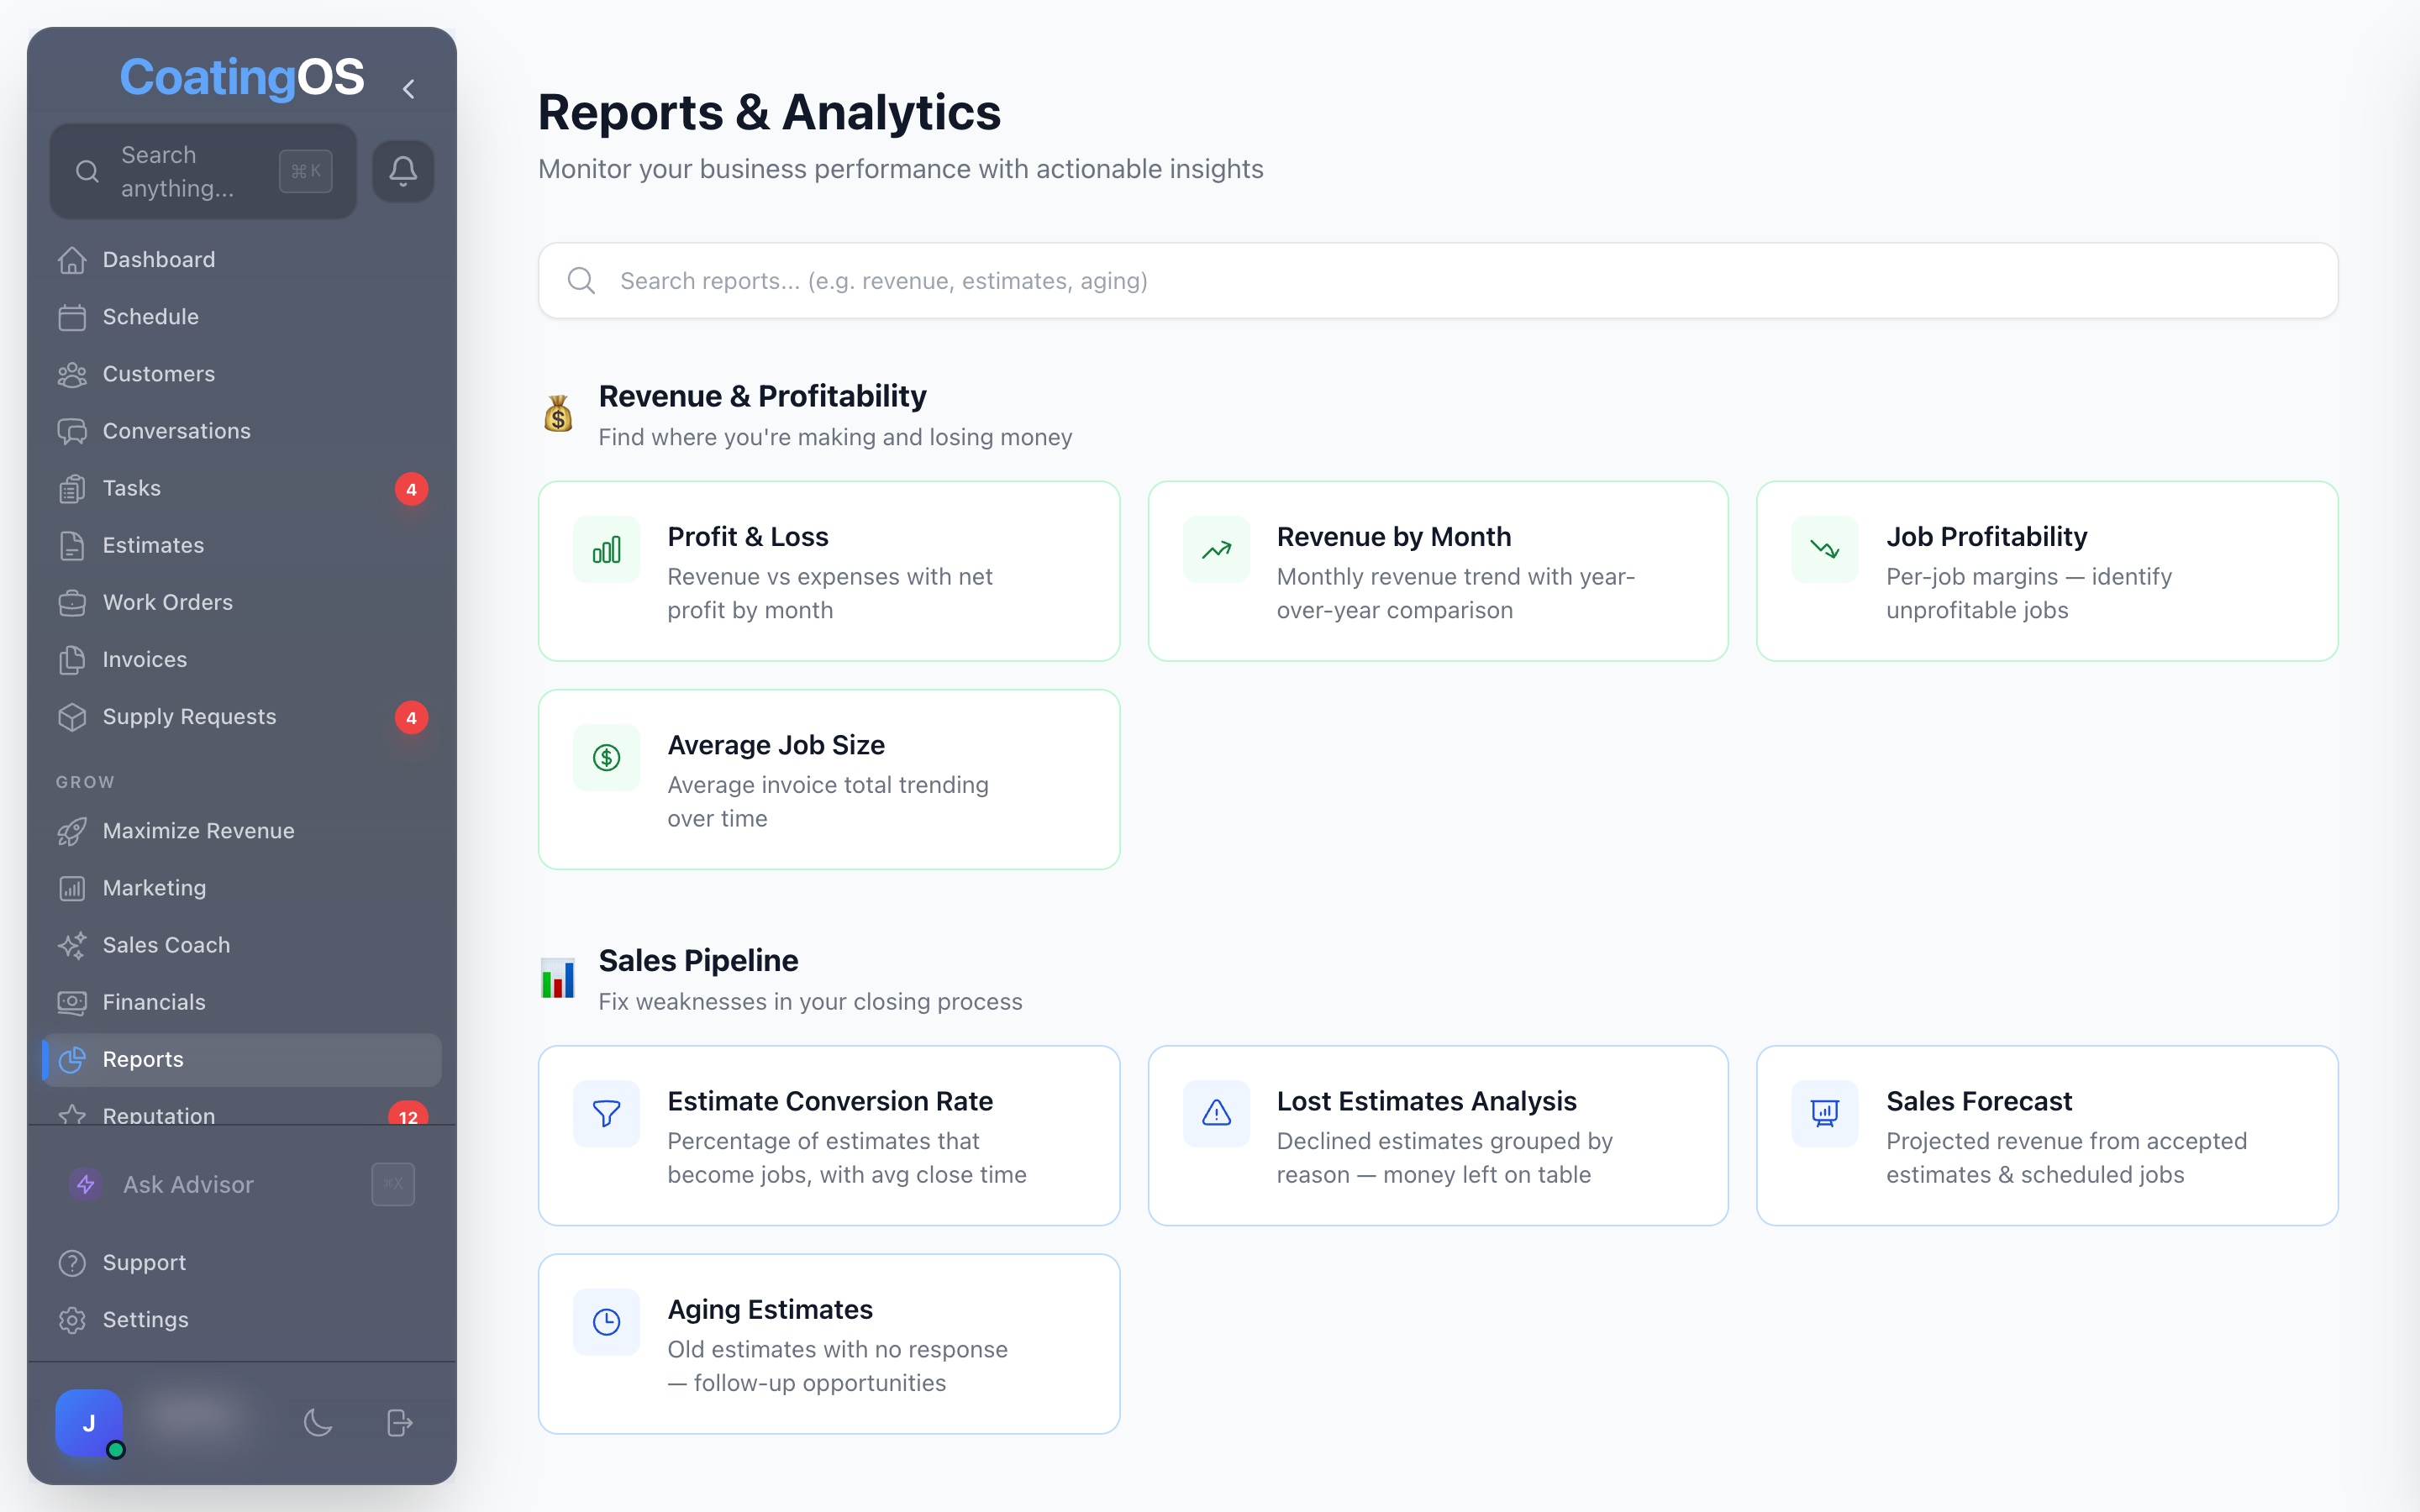
Profit and loss, revenue by month, job profitability, estimate conversion, lost-estimate analysis, sales forecast, aging estimates — one click each, always current, no exports.
Start With Two
If seven feels like a lot, start with the two that move money fastest:
- Job profitability — stop repeating the jobs that lose money.
- Lead source performance — put next month's ad budget where the closings are.
Everything else compounds from there. And if you would rather have all seven running on day one, that is literally what CoatingOS does — built by a founder who runs his own coating company on it (the Loud Bros story), so the reports are the ones a real shop actually uses.


